Transit service is funded through three main sources: provincial contributions, local government contributions and passenger fares.
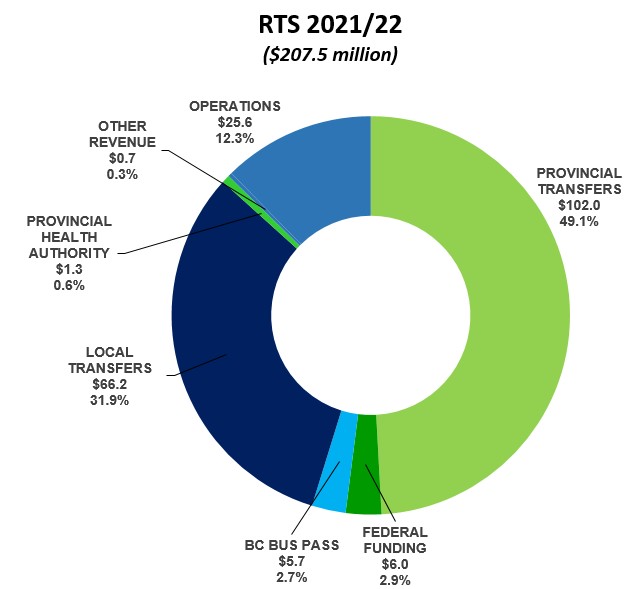
The total cost to run the regional transit systems last fiscal was $207.5 million. Funding for the system came from transit fares and bus advertising (operations) ($25.6 million or 12.3 percent), BC Bus Pass ($5.7 million or 2.7 percent), provincial funding (transfers) ($102 million or 49.1 percent) which includes $10.8 million in Safe Restart funding provided to the Regional Transit systems in 2021/22, provincial health authorities ($1.3 million or 0.6 percent), and local government property taxes (transfers) ($66.2 million or 31.9 percent).
By the Numbers
(2021/22 Fiscal Year End Actuals)
• Total ridership: 21.4 million total trips
• Total fleet: 746 (336 heavy duty, 137 medium duty, 273 light duty)
• Total service hours for conventional service: 1,084,000 hours
• Total service hours for custom/paratransit service: 369,000 hours
Regional Transit Overall Year End Performance (conventional)
Compared to similar sized systems across the country, Regional Transit Systems had:
• 66 percent more conventional passengers per capita
• 68 percent more passengers per hour
• 14 percent lower cost per total service hour
• 49 percent lower operating cost per passenger
Regional Transit System Comparison to Industry Benchmarks
Regional Transit Systems conventional service compares well to similar systems in the Canadian Urban Transit Association (CUTA, 2017) Population Group 4 (service area population 50,000 – 150,000).
Kelowna Regional Transit System (conventional)
Ridership: 4,585,810
Costs and Funding: The total cost to run the service last fiscal was $28.5M.
Funding for the system came from transit fares ($5.2M or 18.1 percent), provincial funding ($14.4M or 50.3 percent), use of Safe Restart funding ($3.5M or 12.3 percent), property taxes ($5.1M or 18.0 percent), and bus advertising ($0.3M or 1.2 percent).
Kamloops Transit System (conventional)
Ridership: 3,131,080
Costs and Funding: The total cost to run the service last fiscal was $18.1M.
Funding for the system came from transit fares ($3.2M or 18.0 percent), provincial funding ($9.1M or 50.6 percent), property taxes ($5.6M or 31.0 percent), and bus advertising ($0.1M or 0.4 percent).
Whistler Transit System (conventional)
Ridership: 1,494,286
Costs and Funding: The total cost to run the service last fiscal was $11.4M.
Funding for the system came from transit fares ($1.1M or 9.8 percent), provincial funding ($5.4M or 47.3 percent), use of Safe Restart funding ($1.9M or 16.6 percent), property taxes ($3.0M or 26.1 percent), and bus advertising ($0.02M or 0.2 percent).
Regional District of Nanaimo (RDN) Transit System (conventional)
Ridership: 2,463,011
Costs and Funding: The total cost to run the service last fiscal was $18.3M.
Funding for the system came from transit fares ($3.0M or 16.3 percent), provincial funding ($9.6M or 52.2 percent), use of Safe Restart funding ($3.7M or 20.1 percent), property taxes ($2.0M or 11.0 percent), and bus advertising ($0.1M or 0.4 percent).
Central Fraser Valley Transit System (conventional)
Ridership: 1,858,491
Costs and Funding: The total cost to run the service last fiscal was $15.6M.
Funding for the system came from transit fares ($2.1M or 13.4 percent), provincial funding ($8.2M or 52.5 percent), use of Safe Restart funding ($1.5M or 9.9 percent), property taxes ($3.7M or 23.8 percent), and bus advertising ($0.1M or 0.4 percent).
Prince George Transit System (conventional)
Ridership: 1,740,010
Costs and Funding: The total cost to run the service last fiscal was $10.0M.
Funding for the system came from transit fares ($1.6M or 16.5 percent), provincial funding ($5.0M or 50.3 percent), use of Safe Restart funding ($1.1M or 11.4 percent), property taxes ($2.1M or 21.5 percent), and bus advertising ($0.02M or 0.2 percent).